
Repro App
The Use cases of KPI Analysis
Funnel Analysis
By analyzing the Drop-off rate in the steps up to the CV event, you can check the points where a lot of Drop-off occurs and discover the flow that easily leads to the CV event.
Use Case
Check the point where users drops-off
Identify users' propensity to break through the funnel
Differences in channel by attribute
Understand how long it takes for a new user to break through the funnel.
Find routes that are easy for users to achieve conversions
Check the point where users drops-off
Consider an EC app as an example. To discover the challenges in the purchase flow, set up the event and create a funnel analysis as follows:
- app launch
- product details
- add to cart
- process purchase
- input personal information
- purchase complete
For example, if you can confirm by funnel analysis that there are many users who have transferred to the purchase process screen but left the personal information input screen, it may be able to be hypothesized that there may be some challenges with the personal information input screen. You can improve the conversion rate by communicating to eliminate the possible challenges .
Identify users' propensity to break through the funnel
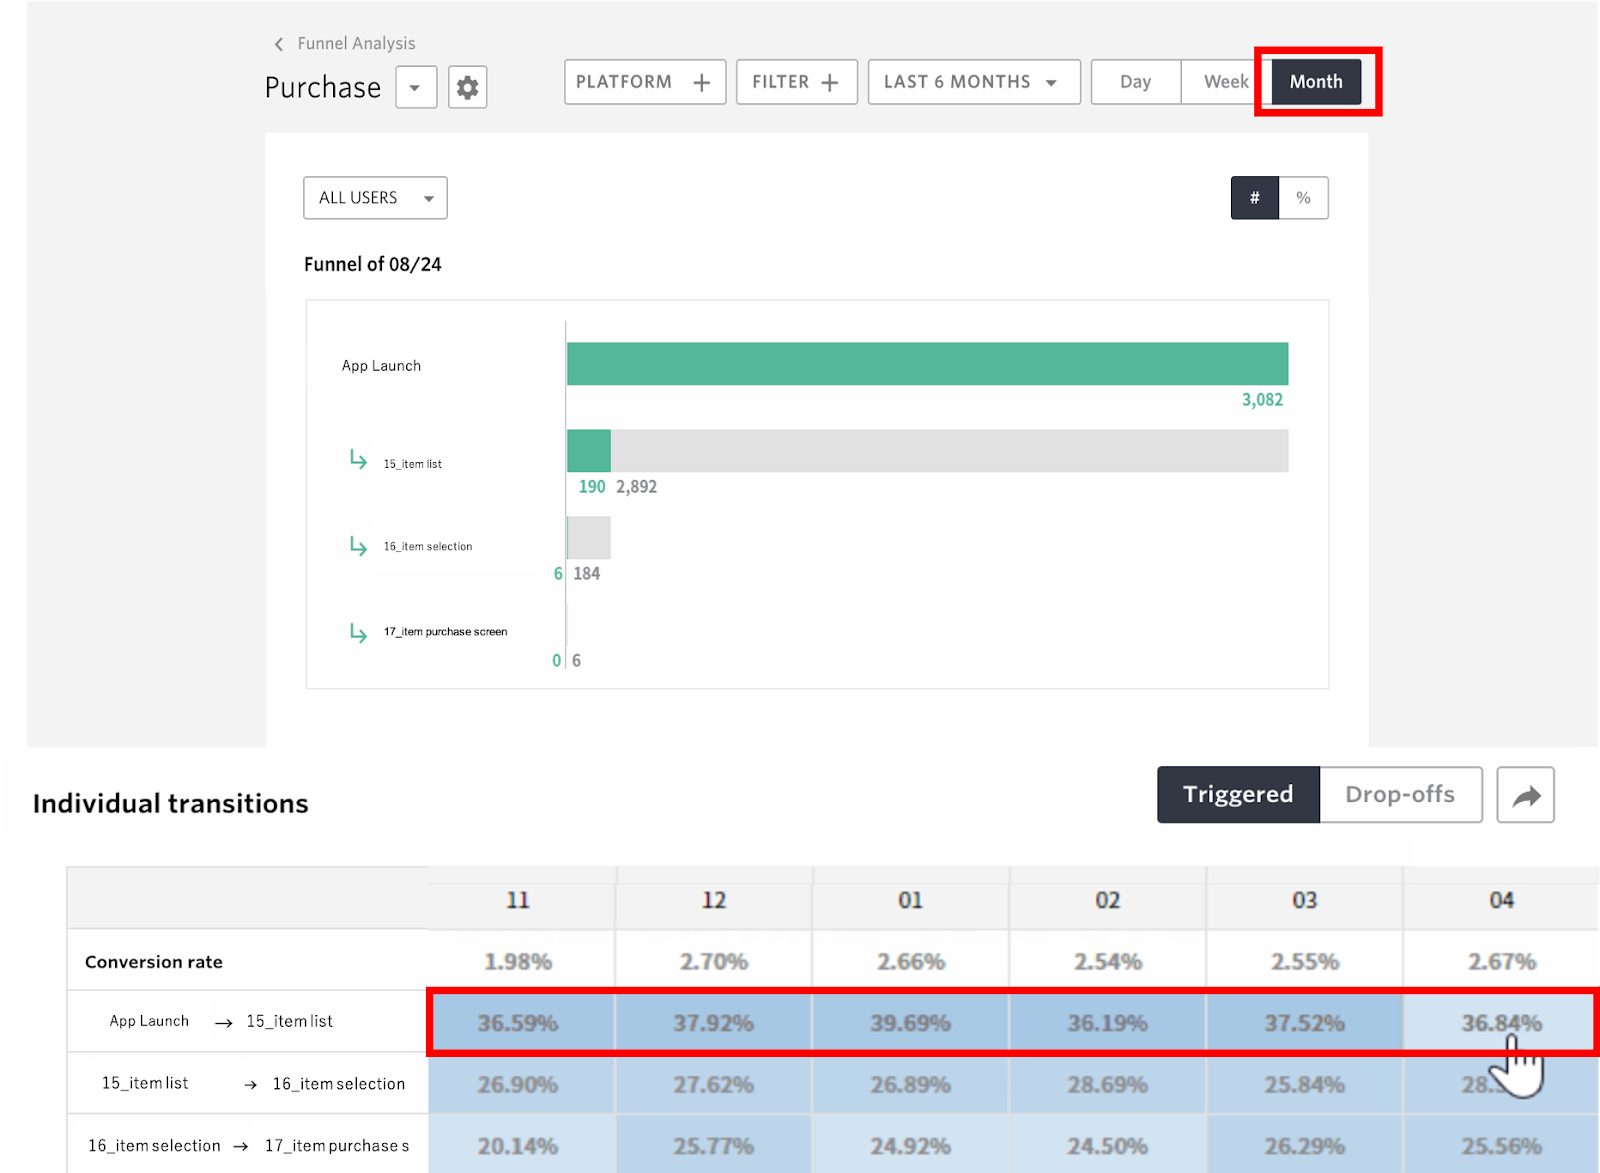
By comparing the number of transitions per interval over a longer period of time, such as days of the week or weeks within a month, we can capture the trend of users breaking through the funnel.
For example, if there is a tendency for account registration breakthrough rates to be higher on Saturdays and Sundays, it can be hypothesized that many users respond to your site on weekends when they have more time, so you can come up with a plan to push to users who have left your site on Saturdays and Sundays in order to resolve this hypothesis.
Differences in channel by attribute
You can compare the funnel breakthrough rate according to user attributes such as male, female and member / non-member.
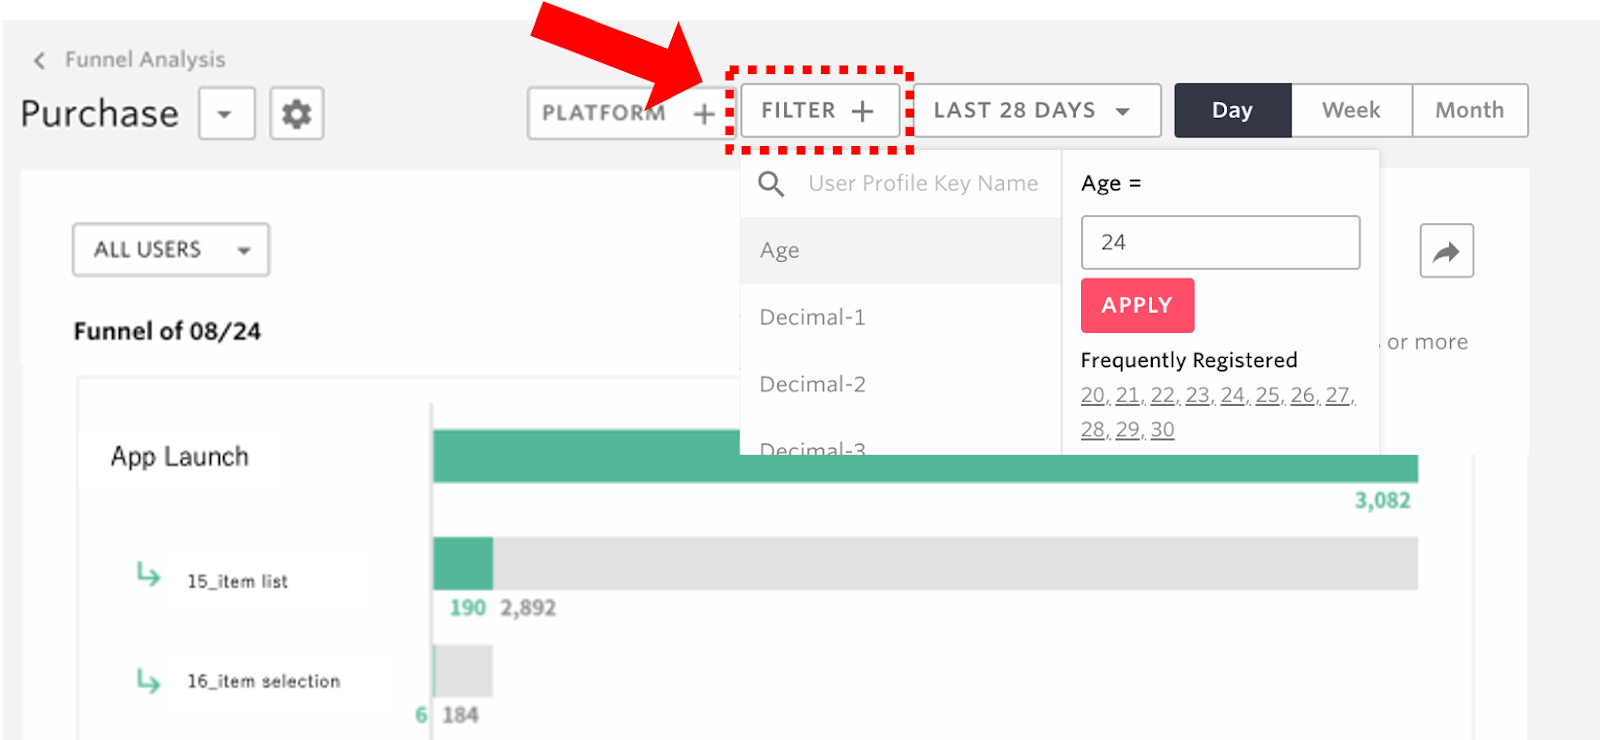
See Set the consitions to analyize for the details.
Understand how long it takes for a new user to break through the funnel.
Find out how long it is taking users to break through the funnel.
You can capture the big picture by understanding your CVR by day, week and month.
For example, less than 5% of users reach the product listings on a daily basis, but more than 30% of users reach the product listings on a monthly basis.
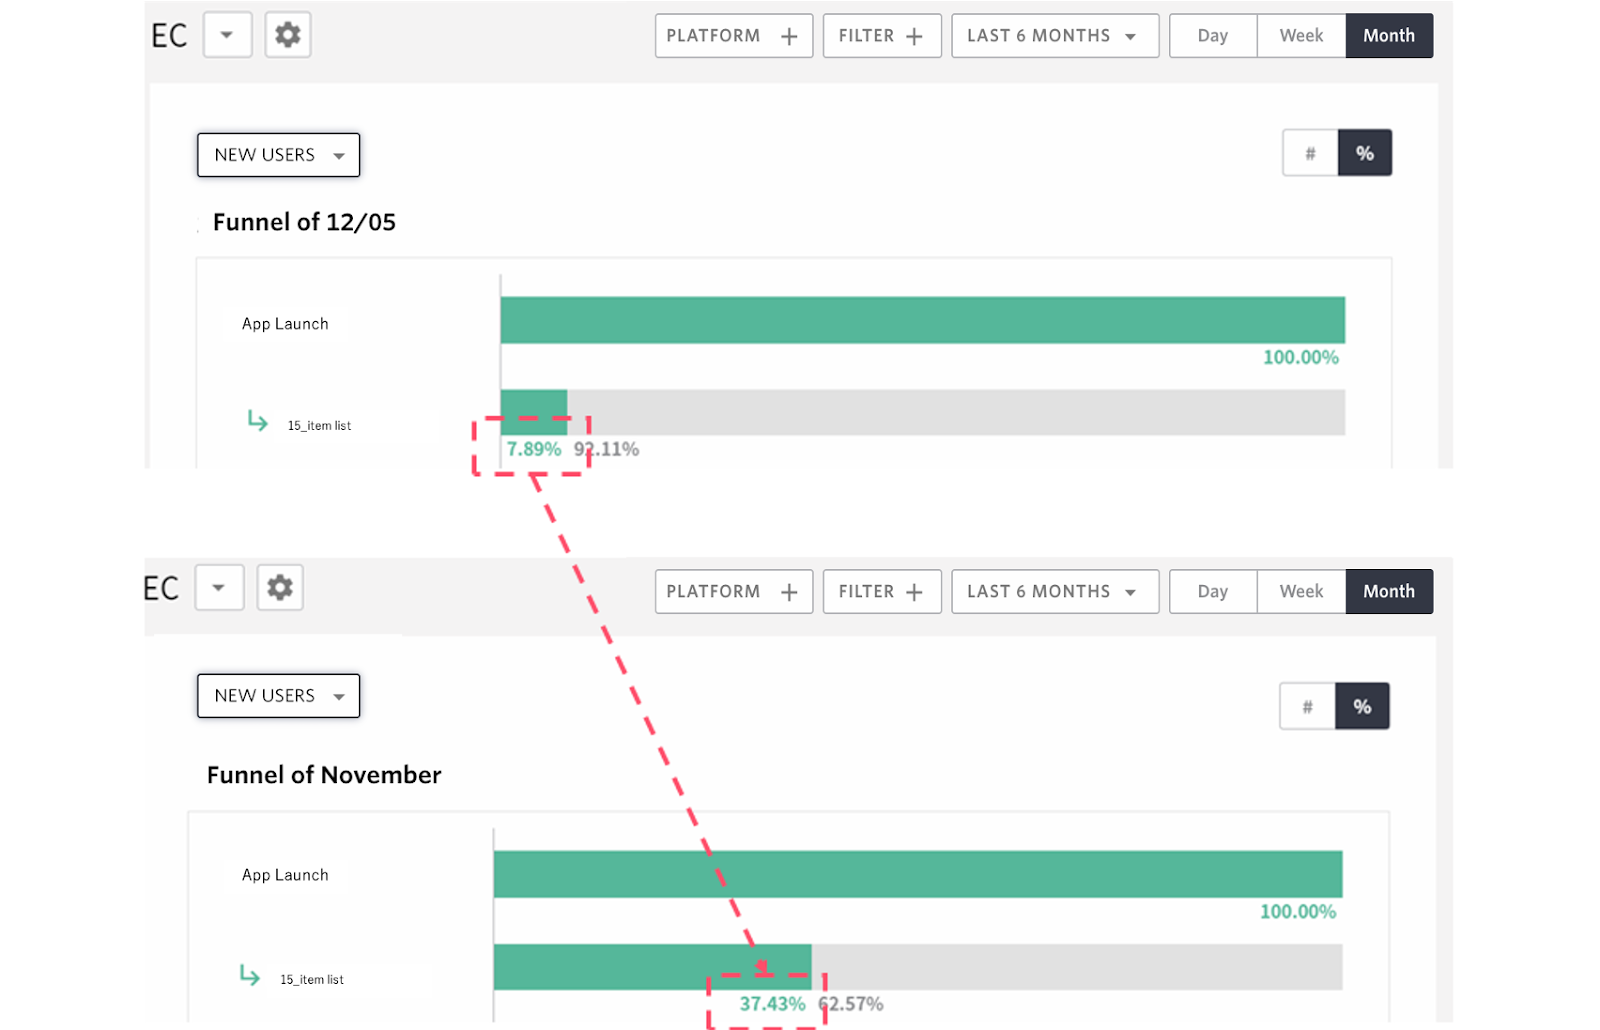
You can also see that if your CVRs are almost identical when checked by day, week, or month, if you don't convert on day one, you're unlikely to convert over time.
Find routes that are easy for users to achieve conversions
By creating multiple funnel analysis, you can find from which route users are most likely to achieve conversions.
For instance, you can create 3 funnels as follows.
- Favorite Purchase
- Search Purchase
- Recommended item list Purchase
By comparing these 3, we can identify that the funnel with the lowest exit rate is the easiest route to buy.