
Repro App
Check the numbers with KPI Analysis
KPI Analysis
With KPI analysis, you can check the user’s event execution rate for each event.
How to check
Please go to ANALYTICS>KPI
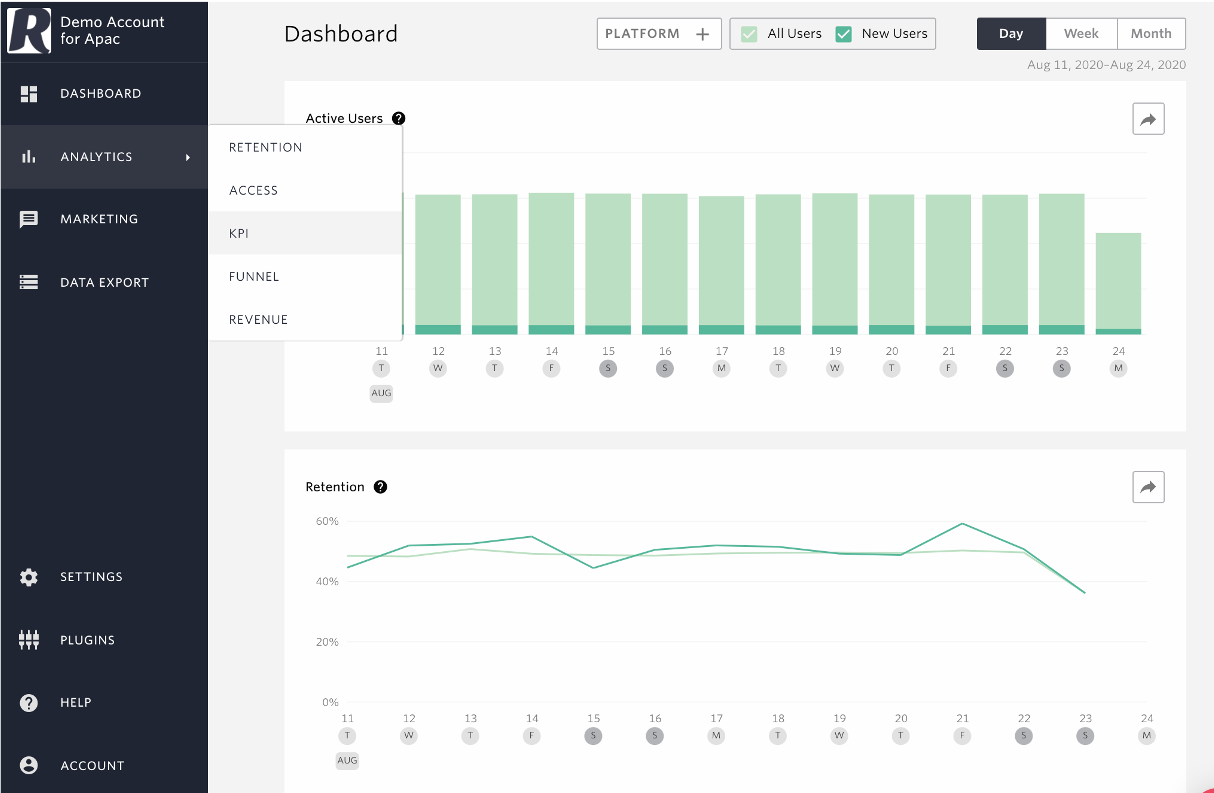
Click the name of KPI you want to see.
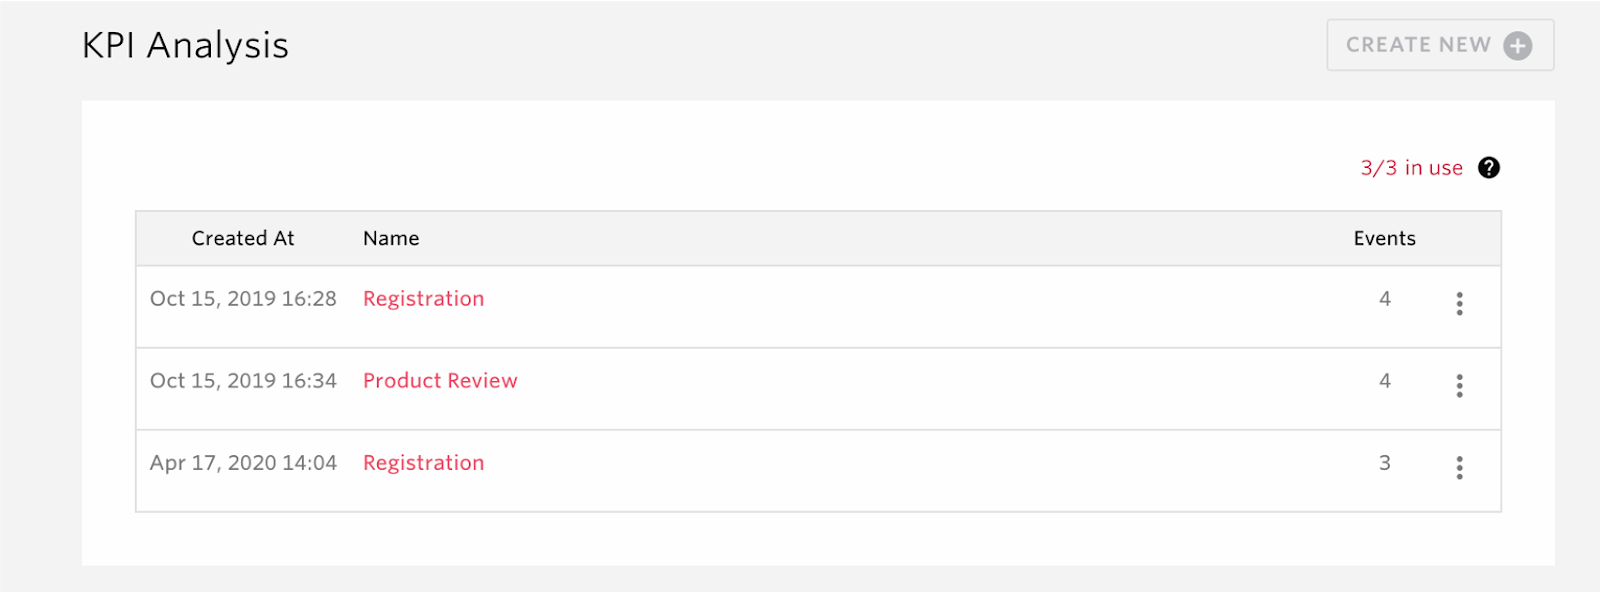
You can see the graph of KPI on the next screen.

How to read the graph
The graph shows the percentage of users who execute the events registered as KPIs.
See Create a new KPI analysis for the details on KPI creation.
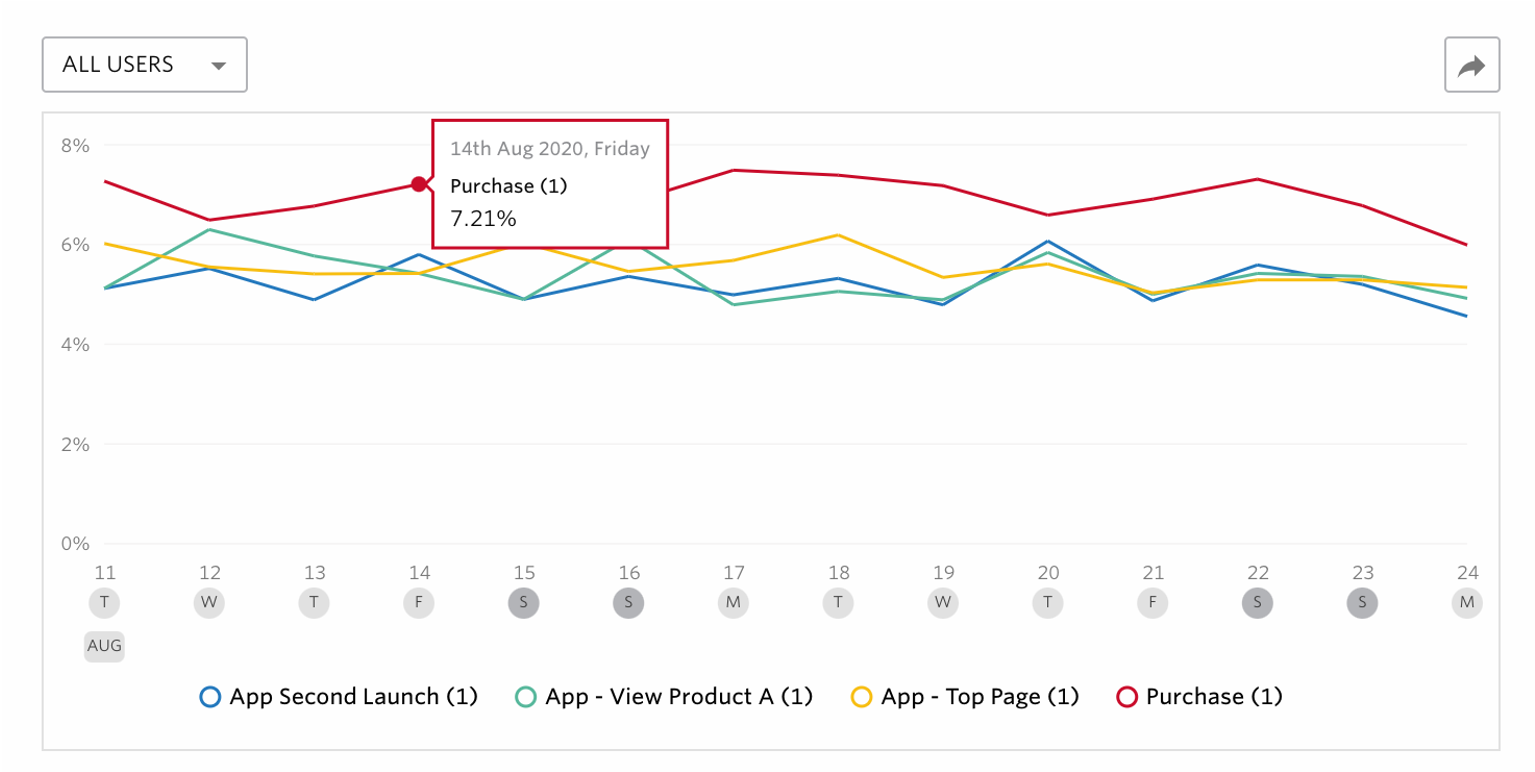
In this graph, you can see that 10.45% of the users who launched the app on Friday November 11th 2019, executed LIKE! once or more than once.

The number inside() shows the execution count. The line of LIKE!(1) shows the rate of users who executed LIKE! for once or more than once and likewise, the line of LIKE!(2) shows the rate of users who executed LIKE! For more than once
Also, you can switch between the percentage of users who triggered and those who Dropped-off.